- Measurement Systems for Airtightness
- High Rise Building
Air permeability measurement of a 125 m high-rise building (project experience)
Stefanie Rolfsmeier, Emanuel Mairinger, Johannes Neubig, Thomas Gayer
Worldwide, there is an increasing demand for testing the air tightness of high-rise buildings with heights of 100 m and more. Air permeability measurements on such high buildings are still pioneering work, which is why the ISO 9972 test standard does not yet sufficiently cover this area.
For the first time in Europe, an air permeability measurement was carried out in a 125 m high building in Vienna in February 2021. Special challenges were the uniform pressure distribution in the building and the handling of stack effect and wind. The measurement was based on the guideline "Airtightness measurement of high-rise buildings" of the Passive House Institute Darmstadt. In addition, differential pressure measuring points were distributed throughout the building envelope to obtain as accurate a picture as possible of the pressure distribution during the measurement.
The 125 m high measurement object has a volume of approx. 77,000 m³. It consists of 38 floors with 670 apartments including two basement floors. A stairwell and four elevators are located in the center of the building. The building is to have an air exchange rate at 50 Pa building pressure difference n50 ≤ 1.5 h-1. The building preparation was done according to method 1 of ISO 9972:2015.
The challenges of this measurement included establishing a uniform induced (fan generated) pressure distribution in the building (max. pressure drop ≤ 10% of the induced building pressure difference between inside and outside over the entire height) and dealing with the high and fluctuating natural pressure differences at the building envelope due to stack effect and wind. Thanks to careful planning, preparation, and exchange between experts from three countries, the measurement was successfully carried out in February 2021.
A week before the test, selected sample apartments were measured to estimate the air flow through 670 supply air elements in the exterior walls and to include them in the calculation of the required number of BlowerDoor fans. During additional site visits, wind speeds, indoor and outdoor temperatures were logged, and differential pressure measurements were taken on the building envelope to provide an overview of the influence of wind and stack effect. It was also checked on site how to establish uniform air distribution throughout the building to allow airflow from leaks in the building envelope to flow to the BlowerDoor fans. In addition to the stairwell, the elevator and fire protection shafts were also considered as flow paths to the measurement devices. The setup locations for the BlowerDoor fan were inspected in order to be able to plan any subframes that might be necessary for the measuring setup.

The measurement concept includes the following contents:
- Determination of the building parts and rooms to be measured
- Calculation of the required airflow in order to check the airtightness
- Planning how to connect all floors in the building via stairwell, lift shafts, etc. to create an air connection to all parts of the building
- Planning the number of BlowerDoor fans and their distribution in the building
- Planning of additional differential pressure measuring points on the building envelope for control during measurement
- Planning of the "measuring center" on the ground floor
- Planning power supply and power connections
First, sections and floor plans from the sub basement to the top floor were used to view and draw in the airtightness plane in order to plan the building preparation and determine which doors to adjacent building areas outside the test object had to be closed. It was particularly challenging to establish a sufficiently large air connection throughout the building so that the same differential pressure could be generated on each floor during the measurement. The uniform pressure distribution depends on the tightness of the building envelope and the size of the openings connecting all floors. The leakier the envelope, the greater the total airflow through all the leaks. Sufficiently large flow paths from the leakage points to the measurement equipment are required. The pressure drop over the entire height of the building should be ≤ 10 % of the induced building pressure difference on the ground floor (measuring center) between inside and outside.
Based on the targeted maximum air change rate, the required airflow at 50 Pa building pressure difference was approx. 105,000 m³/h (plus 19,000 m³/h for the 670 supply air elements as safety). It seemed too risky to establish the air connection over all floors via the narrow stairwell that has only three doors to each floor. Therefore, the doors of a 130 m high elevator shaft were opened to create additional flow paths over the entire height of the building. For safety reasons, only some of the elevator doors were open during the measurement: basement to ground floor, 11th to 13th floor, 21st to 23rd floor, and 33rd to 35th floor.
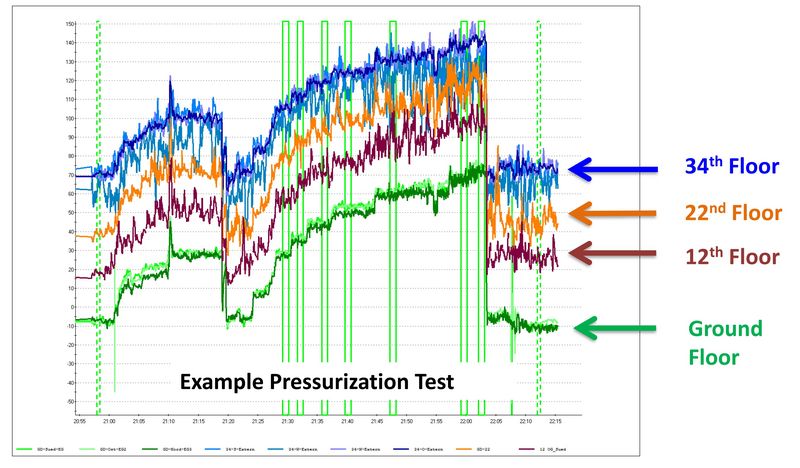
A total of 18 BlowerDoor fans were distributed over four floors (Fig. 1): nine in the measurement center on the ground floor and three fans each on the 12th, 22nd and 34th floors. They were installed in balcony doors on the higher floors so that they could be turned on in the event of a possible drop too large in pressure.

To gain knowledge about the pressure distribution of the building pressure differences on all sides of the building and over the building height, additional measuring points - distributed over all sides of the building - were planned: three on the ground floor and four measuring points each on the 12th, 22nd and 34th floors. On the basis of the measured values, it was possible to check whether the pressure built up evenly in all parts of the building during the measurement. It was also possible to ensure that negative pressure was generated throughout the building during the depressurization test and positive pressure during the pressurization test.
The measurement software (TECLOG) displayed the readings in real time at one-second intervals. In the live diagram, the measurement graphs for the building pressure differences, the individual airflows of the fans and the total airflow could be followed. So, it was possible to react immediately to the excessive pressure drop after the start of the measurement.
Nine fans on the ground floor (total airflow approx. 65,000 m³/h) were turned on, but the pressure drop in the upper part of the building was significantly higher than 10% of the generated pressure on the ground floor. By turning on the three BlowerDoor fans on the 22nd floor and reducing the airflow on the ground floor, the pressure drop was compensated. At the end of the airtightness test, the average value of the airflow at 50 Pa from the depressurization and pressurization test was about 60,000 m³/h, the air change rate n50 = 0.76 h-1. The airtightness requirement for the building was achieved.
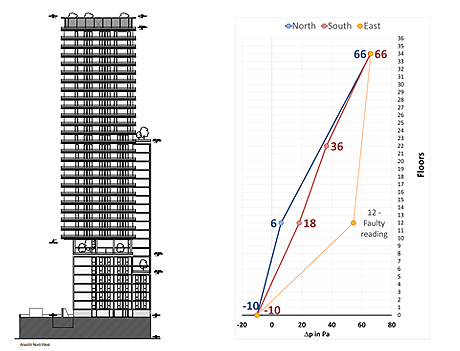
Due to the tall height of the building and a temperature difference of 17 K between indoor and outdoor temperatures, the building showed very high natural building pressure differences (stack effect). The readings on the top floor showed around +70 Pa and on the ground floor of around -10 Pa. Based on these values, the test points of the depressurization test were chosen in such a way that a negative pressure applied throughout the building during this measurement, and a positive pressure applied during the pressurization test (Fig. 4). Furthermore, the natural pressure differences showed that the neutral pressure plane in this building was between the fourth and fifth floors. It is often expected to be halfway up the building. This meant that much of the leakage was in the lower part of the building.
On the day of measurement, the wind force was about 3 Beaufort. Figure 3 shows the natural building pressure differences, and the building pressure differences with the fans running during the measurement for all sides of the building and across the building height. The fluctuations of the building pressure are lowest on the ground floor and increase on the higher floors: The influence of wind on the building pressure difference increases with increasing building height.
Summary
The measurement is based on the Passive House Institute's guideline for airtightness measurement of high-rise buildings. Careful preparation of the building and the measurement is necessary to obtain a uniform induced pressure distribution over the building height during the measurement. The leakier the building envelope, the larger the openings across the stairwell and/or shafts must be to achieve uniform pressures in all parts of the building.
It makes sense to set up the measuring center on the ground floor to control the BlowerDoor fans centrally from this location. This is also where most of the measuring fans are usually installed. Pressure fluctuations due to wind are lowest on the ground floor and increase with increasing building height. In order to establish a stable basis for controlling the measuring fans even in windy conditions, it is another good reason to install the devices on the ground floor. If there is a risk that the openings for flow paths within the building may not be sufficient, additional BlowerDoor fans should be installed on higher floors, preferably on the leeward side of the building. These fans can be switched on one after the other if necessary.
The wind speed during the measurement should be less than or equal to 3 Beaufort. It is recommended that the temperature difference between the inside of the building and the outside does not exceed 8 to 10 K for a 125 m high building. If a high stack effect and / or wind is expected at the measurement date, additional measurement points for the building pressure difference should be installed. Four measuring points, one on each side of the building, on the ground floor and on the top floor provide a meaningful picture of the pressure distribution over the height. The control of the BlowerDoor fans can be set to the average building pressure on the ground floor. This building pressure is also used to determine the air leakage graph. The recording time for each test point of the multipoint test can be extended to 60 to 120 seconds in gusty wind conditions to reduce the scatter of the test points and increase the accuracy. The readings of the building pressure on the top floor are used for control purposes. During the air tightness test, they indicate whether there is a negative pressure throughout the building during the entire depressurization test and a positive pressure during the pressurization test.
Special thanks go to the co-authors Emanuel Mairinger, Johannes Neubig, Thomas Gayer as well as Gary Nelson and Collin Olson and last but not least to all colleagues who provided support before, during and after the measurement.
Literature
Peper, S; Schnieders, J. (2019): Luftdichtheits-Messung von Hochhäusern. Passivhaus Institut, September 2019
Rolfsmeier, S. (2015): Luftdurchlässigkeitsmessung großer Gebäude In: Fachverband Luftdichtheit im Bauwesen e. V. (Hrsg.): Gebäude-Luftdichtheit, Band 2, Berlin 2015
Project management:
Emanuel Mairinger (Dr. Ronald Mischek, ZT GmbH, Donau-City-Straße 1, A-1220 Vienna).
Project partners:
Johannes Neubig (City of Vienna, Municipal Department 39, Rinnböckstraße 15/2, A-1110 Vienna).
Thomas Gayer (City of Vienna, Municipal Department 39, Rinnböckstraße 15/2, A-1110 Vienna)
Consulting and measurement support:
Stefanie Rolfsmeier (BlowerDoor GmbH, Zum Energie- und Umweltzentrum 1, 31832 Springe).
Gary Nelson (The Energy Conservatory, Minneapolis (USA))
Collin Olson (The Energy Conservatory, Minneapolis (USA))